Beef vs. Pork p-value: 0.275 
For this project, I examined the dataset FatRats, which has data from an experiment on the effects of diet on the weight gain of rats. The study had 60 baby rat participants, which were split up into groups and fed different sources of protein (Beef, Cereal, and Pork). The resulting dataset shows the weight gain for each rat from their protein source.
I decided to conduct a randomization-type test by simulating the behavior under the null hypothesis. I wanted to see if the results of weight gain from different protein sources is statistically significant. I did this by running simulations of the study and randomizing the protein source to see if a random test would produce significantly different responses than the experiment did.
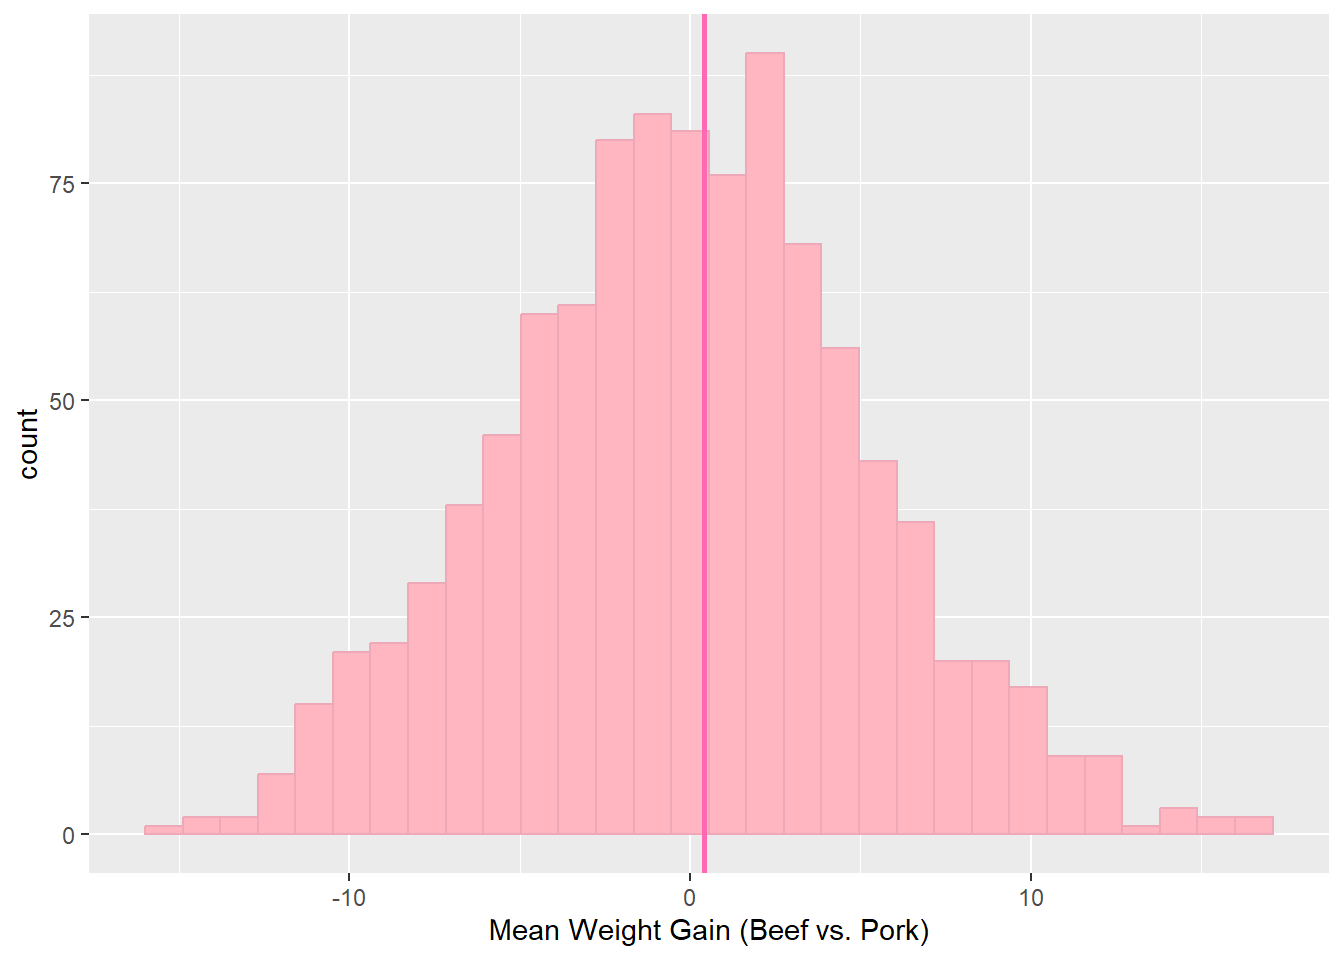
The following graphs show the difference in average weight gains between different proteins with the randomized test, which shows what might happen if the type of protein had no effect. The hot pink vertical line shows the average weight gain from the study that was run. The p-values below each chart show the probability under the null hypothesis (our randomized experiment) of obtaining a test statistic at least as extreme as the one obtained. The p-values are calculated by looking at how many of the randomized statistics are greater than or equal to the observed statistics from the rat study.
Beef vs. Pork p-value: 0.275 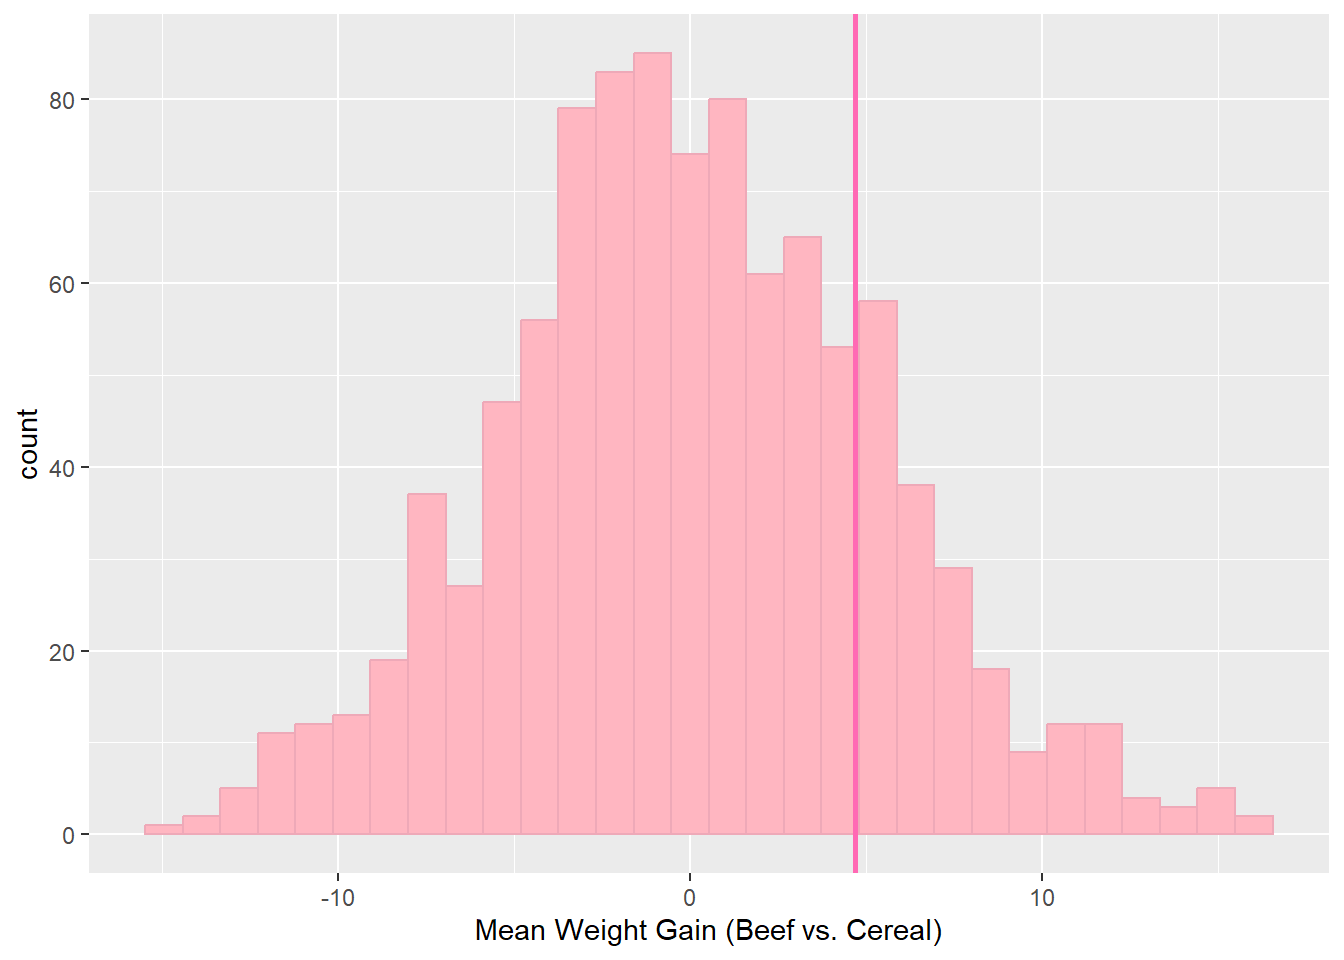
Beef vs. Cereal p-value: 0.296 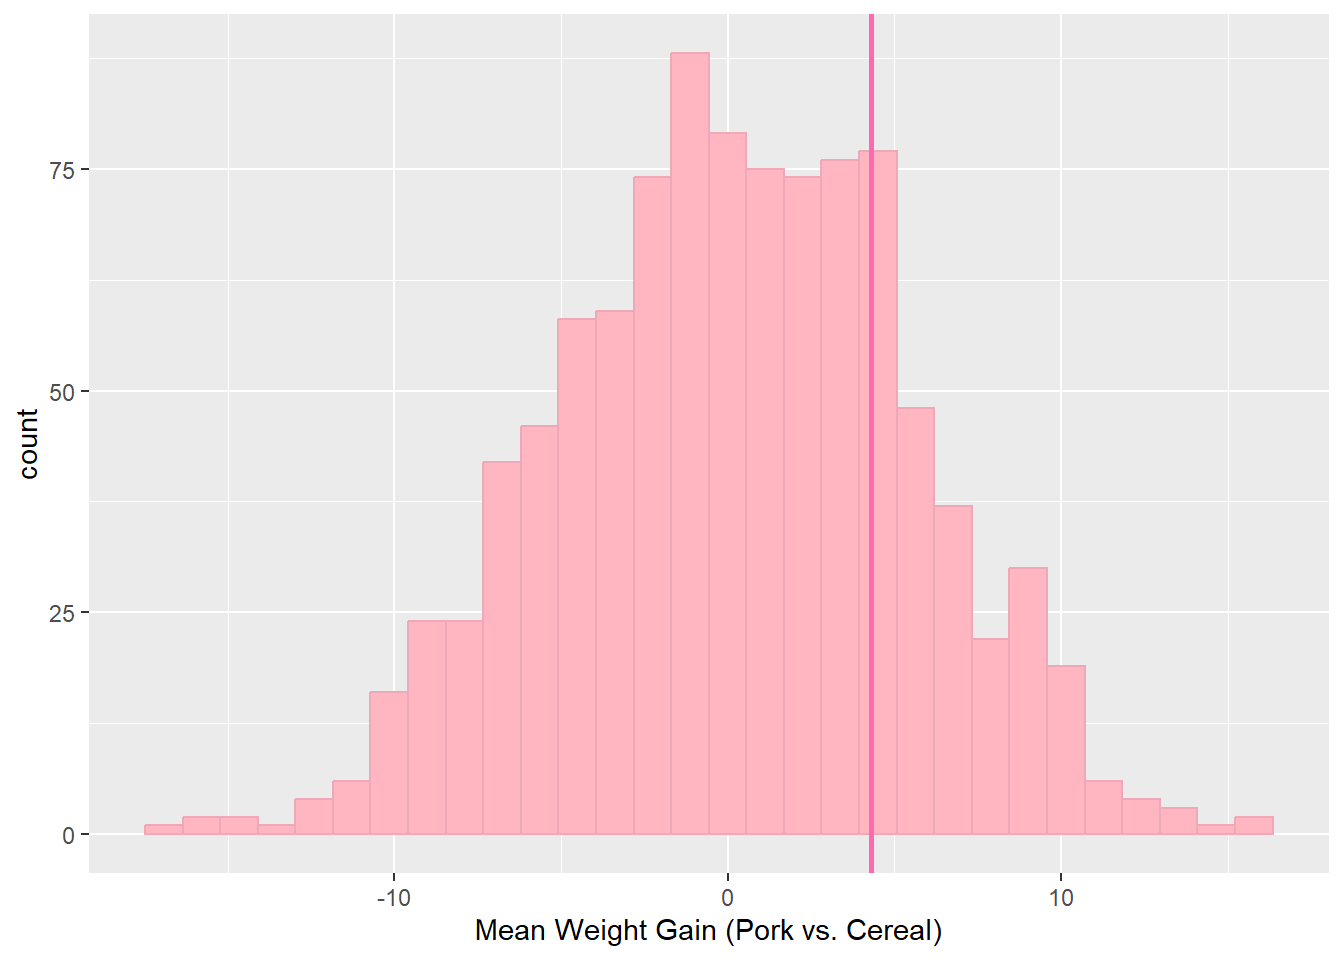
Pork vs. Cereal p-value: 0.291 As we can see, all of the p-values are close to 0.3. Generally, if the p-value is less than 0.05, we will consider the results of the study statistically significant. Because these results are well over the point of statistical significance, we can fail to reject the null hypothesis and claim that the difference in weight gains due to different proteins is not statistically significant.